Illinois Department of Health Not Matching CDC
County level metrics provided by the Illinois Deparment of Public Health does not match that put out by the CDC. Specifically the rate per 100K residents. The 2010 Census reports 269,282 residents in the county. University students testing positive are being counted as county residents, but those students are not considered residents and they should either be counted in their home county or the denominator should be changed to accommodate the change in population.
Below, I show the work (which is not done by the IDPH).
library(dplyr)
library(ggplot2)
library(lubridate)

url <- c("https://raw.githubusercontent.com/nytimes/covid-19-data/master/us-counties.csv?_sm_au_=iVVqLPMMPWSDkHHq6jkjvKQBQqvNG")
counties <- read.csv(url)
rm(url)

counties$county <- as.factor(counties$county)
counties$state  <- as.factor(counties$state)
counties$fips <- as.numeric(counties$fips)
counties$date <- as.Date(counties$date)

counties <- counties %>% group_by(state,county)%>%
  mutate (newcases = cases- lag(cases),
          newdeaths = deaths - lag(deaths))%>%
  ungroup()

counties$newcases <- ifelse(is.na(counties$newcases)==TRUE, 0,counties$newcases)
counties$newdeaths <- ifelse(is.na(counties$newdeaths)==TRUE, 0,counties$newdeaths)

##Same week system used in IDPH & CDC
counties$week <- epiweek(counties$date)

counties%>%filter(fips==17119,week==32)%>%
  summarise(newcases=sum(newcases),
            per100K = newcases/269282*100000)
## # A tibble: 1 x 2
## newcases per100K
## <dbl> <dbl>
## 1 393 146.IDPH is showing 153 (4% difference). How off are they with other counties?
Continuing to show my work and the trends coming from Madison County
Madison<- counties%>%
  filter(fips==17119)%>%
  group_by(week)%>%
  summarise(WeeklyCases = sum(newcases),
            WeeklyDeaths = sum(newdeaths))%>%
  mutate(DeathsPer100K = WeeklyDeaths/269282*100000,
         CasesPer100K = WeeklyCases/269282*100000)

ggplot(Madison,aes(x=week,y=CasesPer100K))+
  geom_point()+
  geom_smooth()+
  labs(title = 'Madison Co, Illinois Cases per 100K by week of year')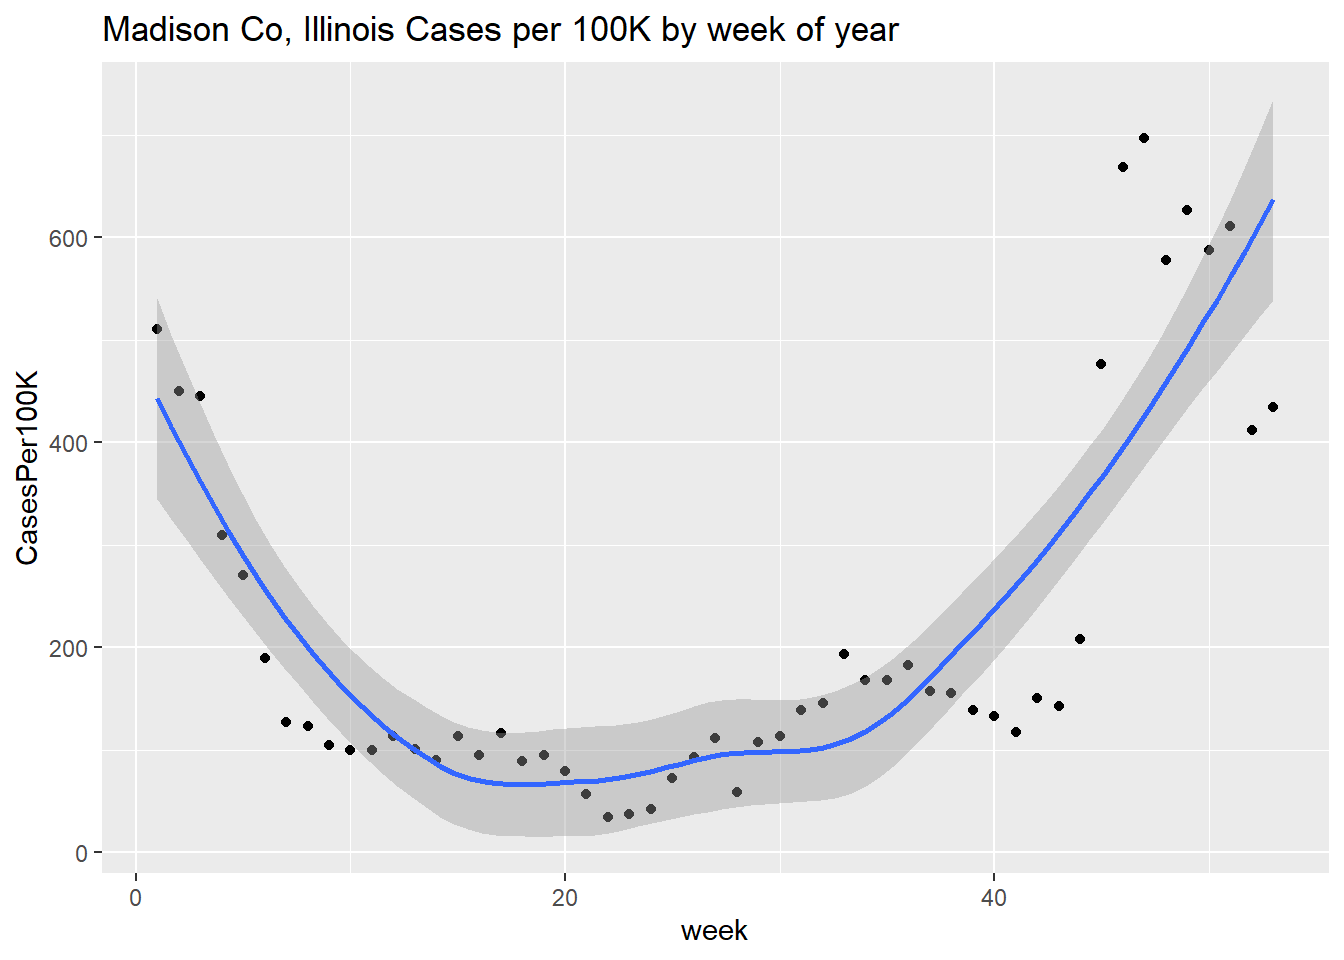
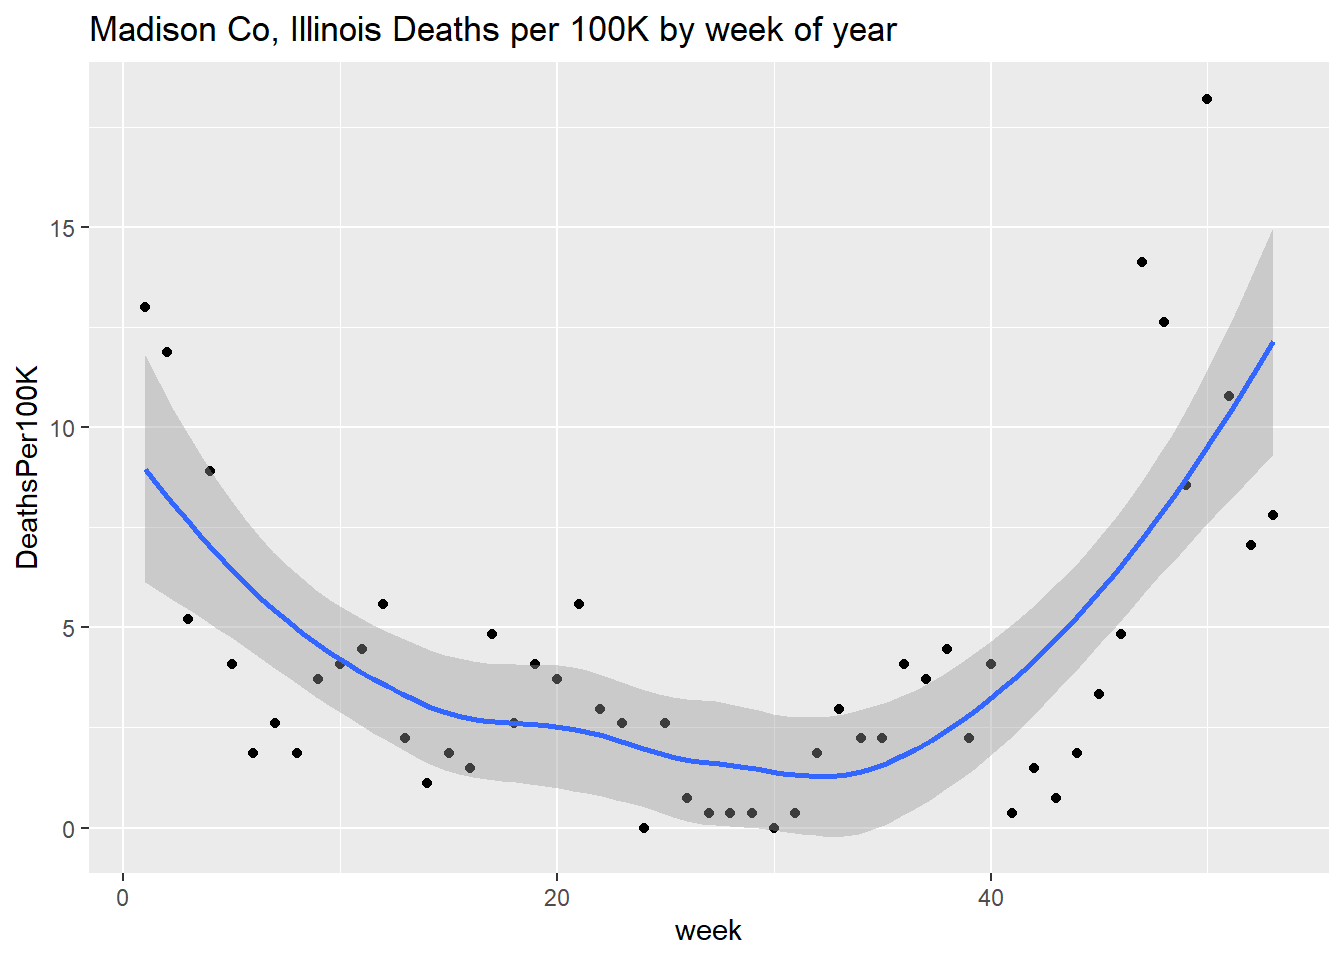
ggplot(Madison,aes(x=week,y=DeathsPer100K))+
  geom_point()+
  geom_smooth()+
  labs(title = 'Madison Co, Illinois Deaths per 100K by week of year')